|
INSULAR AREAS |
Area km² |
Coasts Length(km) |
Population |
Density |
GNP |
GNP |
GNP |
Working rate |
Unemploy- |
Primary sector |
Secondary sector |
Tertiary sector |
|
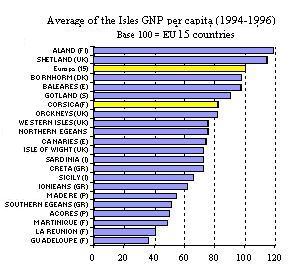
ACORES (P) |
2 333 |
687 |
242 050 |
104 |
2 193 |
9 060 |
50 |
49,6 |
7,2 |
20,4 |
22,6 |
57,0 |
|
ALAND (FI) |
1 524 |
1 050 |
25 230 |
17 |
542 |
21 478 |
119 |
nd |
7,2 |
8,4 |
15,6 |
76,0 |
|
BALEARES (E) |
5 013 |
1 120 |
762 034 |
152 |
13 388 |
17 569 |
97 |
50,7 |
14,0 |
5,0 |
30,0 |
65,0 |
|
BORNHORM (DK) |
588 |
105 |
45 102 |
77 |
795 |
17 619 |
97 |
nd |
8,9 |
10,0 |
23,0 |
67,0 |
|
CANARIES (E) |
7 447 |
1 491 |
1 610 173 |
216 |
21 665 |
13 455 |
74 |
49,4 |
22,0 |
7,4 |
18,4 |
74,2 |
|
CORSICA (F) |
8 681 |
1 047 |
261 250 |
30 |
3 880 |
14 850 |
82 |
39,3 |
14,7 |
7,0 |
18,0 |
75,0 |
|
GOTLAND (S) |
3 140 |
800 |
58 048 |
18 |
945 |
16 285 |
90 |
nd |
8,9 |
8,6 |
21,2 |
70,2 |
|
GUADELOUPE (F) |
1 705 |
670 |
425 150 |
249 |
2 773 |
6 523 |
36 |
nd |
29,3 |
7,1 |
20,1 |
72,8 |
|
IONIEANS (GR) |
1 969 |
834 |
199 350 |
101 |
2 233 |
11 201 |
62 |
52,9 |
5,5 |
28,0 |
19,0 |
53,0 |
|
ISLE OF WIGHT
(UK) |
380 |
92 |
125 466 |
330 |
1 648 |
13 137 |
73 |
nd |
9,9 |
3,0 |
30,0 |
67,0 |
|
CRETA (GR) |
8 291 |
1 046 |
559 273 |
67 |
7 339 |
13 122 |
72 |
56,4 |
3,4 |
32,0 |
18,0 |
50,0 |
|
MADERA (P) |
797 |
191 |
257 670 |
323 |
2 541 |
9 862 |
54 |
61,9 |
5,5 |
12,2 |
28,8 |
59,0 |
|
MARTINIQUE (F) |
1 100 |
350 |
389 900 |
354 |
3 441 |
8 825 |
49 |
nd |
27,2 |
7,4 |
16,3 |
76,3 |
|
NORTHERN
AEGEANS(GR) |
5 011 |
2 964 |
267 866 |
53 |
3 652 |
13 633 |
75 |
45,3 |
4,9 |
13,0 |
26,0 |
61,0 |
|
ORKNEYS (UK) |
956 |
977 |
19 800 |
21 |
292 |
14 771 |
82 |
nd |
4,5 |
27,0 |
20,0 |
53,0 |
|
LA REUNION (F) |
2 507 |
207 |
669 650 |
267 |
4 951 |
7 394 |
41 |
nd |
36,8 |
5,1 |
15,1 |
79,8 |
|
SARDAIGNE (I) |
24 090 |
1 636 |
1 661 826 |
69 |
21 815 |
13 127 |
73 |
45,4 |
21,8 |
13,0 |
25,2 |
61,8 |
|
SHETLAND (UK) |
1 468 |
1 450 |
23 020 |
16 |
477 |
20 709 |
114 |
nd |
3,4 |
18,0 |
20,0 |
62,0 |
|
SICILY(I) |
25 708 |
1 425 |
5 097 769 |
198 |
60 658 |
11 899 |
66 |
41,5 |
24,0 |
14,0 |
21,0 |
65,0 |
|
SOUTHERN AEGEANS (GR) |
3 817 |
1 357 |
184 279 |
48 |
1 726 |
9 366 |
52 |
42,7 |
7,1 |
25,0 |
22,0 |
53,0 |
|
WESTERN ISLES
(UK) |
2 898 |
2 688 |
28 880 |
10 |
394 |
13 639 |
75 |
nd |
9,9 |
15,0 |
19,0 |
66,0 |
|
|
|
|
|
|
|
|
|
|
|
|
|
|
|
Europa (15) |
3 191 120 |
nd |
373 607 000 |
117 |
6 763 408 |
18 103 |
100 |
66,0 |
10,8 |
5,0 |
29,4 |
65,6 |
|
|
|
|
|
|
|
|
|
|
|
|
|
|
|
Moyenne des
îles |
5 211 |
1 057 |
614 942 |
118 |
7 493 |
12 224 |
68 |
nd |
13,1 |
13,7 |
21,4 |
64,9 |
|
Moyenne
ultrapériphérie |
2 648 |
599 |
599 099 |
226 |
6 261 |
10 573 |
58 |
nd |
21,3 |
9,9 |
20,2 |
69,9 |
|
Moyenne
îles centrales |
6 236 |
1 239 |
621 280 |
100 |
7 986 |
12 853 |
71 |
nd |
9,9 |
15,2 |
21,8 |
63,0 |
Source : Eurostat / Eurisles
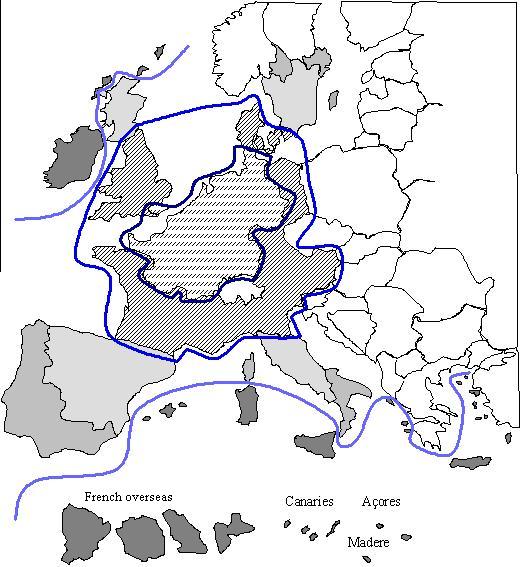
Isodistances following Eurisles.org
Part of the transport in import costs
|
|
|
freight
cost |
importations |
Part
of the
freight |
|
|
|
|
|
|
|
1980 |
World |
123,3 |
1
856,8 |
6.6 |
|
|
Developed countries |
78,3 |
1
426,0 |
5.5 |
|
|
Underdeveloped countries |
45,0 |
430,9 |
10.4 |
|
|
|
|
|
|
|
1990 |
World |
173.
1 |
3
314.3 |
5.2 |
|
|
Developed countries |
117.
0 |
2
661.6 |
4.4 |
|
|
Underdeveloped countries |
56.1 |
652.
6 |
8.6 |
|
|
|
|
|
|
|
2000 |
World |
342.6 |
6
147.1 |
5.6 |
|
|
Developed countries |
191.1 |
4
439.6 |
4.3 |
|
|
Underdeveloped countries |
151.5 |
1
707.5 |
8.8 |
|
|
|
|
|
|
|
2003 |
World |
379.2 |
7
052.9 |
5.4 |
|
|
Developed countries |
195.1 |
5
029.3 |
3.9 |
|
|
Underdeveloped countries |
184.1 |
2
023.6 |
9.1 |
|
|
|
|
|
|
Following CNUCED 2005 Review of maritime transport